skip to main
|
skip to sidebar
Daily Emini Note
Crude Oil Note
StockMONSTER TV
All Charts
Market Commentary
Articles
Nasdaq Notes
Social Investing
Triangles
Set ups
Triangle Trading
Gold Charts
Partners
SUBSCRIBE
Follow
Live Trading
Daily Reading
The Mcverry Report
Crackerjack Finance
Themis Trading
Shanky's Tech Blog
Q Finance
Zero Hedge
Stone Street Advisors
Take a Report
stockMONSTER
Insightful Individuals
EX-SKF
Asahi: Japan objected to IAEA defining contamination zone for food
2 hours ago
innerfx.com
3 hours ago
The Oil Drum - Discussions about Energy and Our Future
23 hours ago
CALIBRATED CONFIDENCE
3 days ago
The Market Guardian | Monitoring The Financial World
It’s Official – US, UK To Release Strategic Oil Stocks
3 days ago
Expected Returns
The Proper Thought Process for the Debt Crisis
1 week ago
The Market Oracle
1 week ago
The Life, The Markets, The Outcome | Kevin Michael Hughes
Anything new?
4 months ago
The Debts of a Nation
Occupy Wall Street - Marine vs 30 Cops
5 months ago
StockWeb
George Soros investments
1 year ago
Bad Follow Thru
The Admin Spin Team Keeps Frittering, While the Republicans Just Scream
2 years ago
Erik's Market Blog
$USD updates
2 years ago
StockStop.org - Index page
Show 10
Show All
Wednesday, January 18, 2012
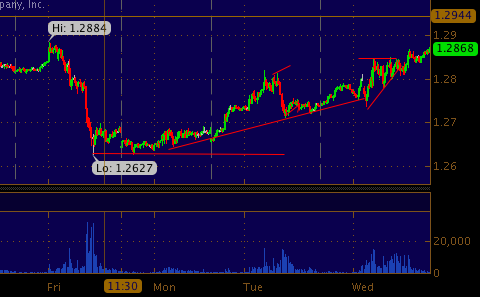
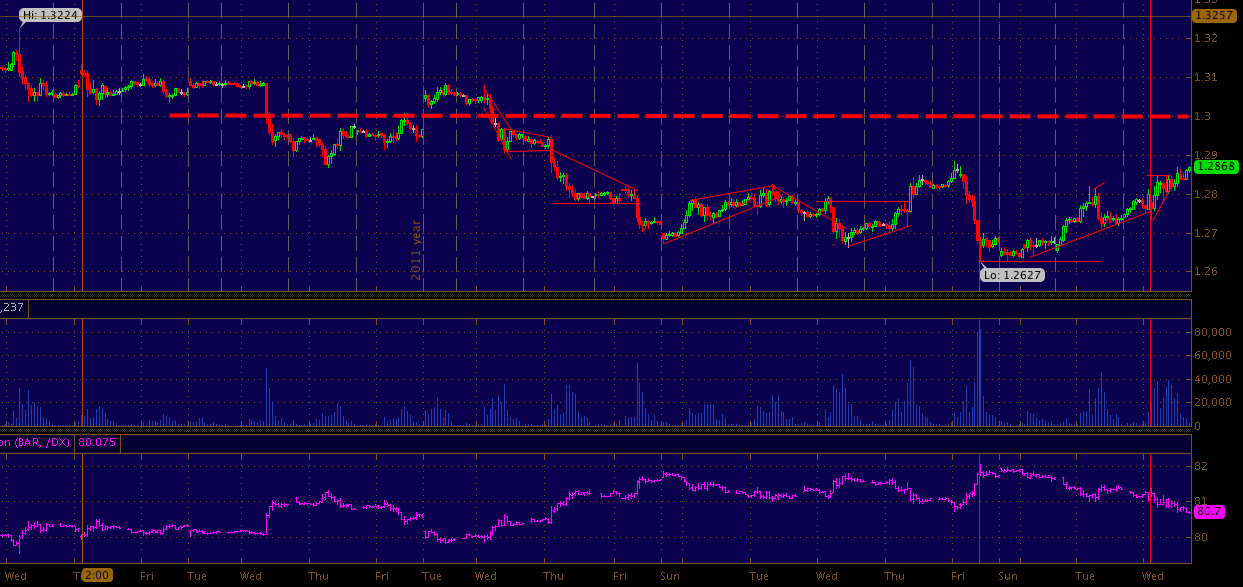
Deal or no Deal - Euro Continues the march towards 1.3 crime scene
By Sell Puts
1/18/2012 04:54:00 PM
5 min euro dollar futures
IF i had a trillion dollars... Id be rich.
1 hour euro dollar futures
Posted in: Chart,EUR/USD,european debt crisis
Newer Post
Older Post
Home
TraderSmarts Premium Live Intraday Trade Alerts
Most Read
Archives
Popular Posts
A look at the VIX - 15min and Daily chart-
15 min VIX. post spike VIX has popped here in the minutes before FOMC some 8 percent into 16.02. Some big player is buying puts. 15...
1370 Trades & Nasdaq Makes a 2012 High - S&P Futures Chart
15 min ES The 1368-1360 channel as been breached.. to the upside , i spoke about this morning.... The Euro is seeing strength again...
A look at the 30 year Bond
1 hour ZB The 140 level in ZB gave way with conviction, the auction today at 1 really did not help the equation. Equity markets large...
Friday's 1 hour S&P Futures look
The S&P500 futures failed to hold 1400, though are above 1 hour trend support. At this current 30 seconds in time the SPX & RUT are both pla...
Light Sweet Crude has "pinched' itself into a new trend
Resistance of 106.50 failed to contain the buying today in CL which caused a flurry of buy stops to be triggered above the downtrending chan...
Archives
▼
2012
(176)
►
March
(31)
Light Sweet Crude has "pinched' itself into a new ...
Friday's 1 hour S&P Futures look
Today's Apple Chart -
A look at the 30 year Bond
Russell 2000 - small cap
A look at the VIX - 15min and Daily chart-
Tuesday Morning S&P500 Futures look
Monday Night Light Sweet Oil Futures Look
1370 Trades & Nasdaq Makes a 2012 High - S&P Futur...
March 12 S&P500 Futures Chart
Sunday evening S&P Futures Look
Recap of the RUT this week.
Updated - XHB weekly look
Pre February Non-farm Payroll S&P500 Futures Look
One and 5 minute inverse H&S in the S&P500
Pre Jobless Claims S&P500 Futures Look
This Evening's 15min ES look -
5min and 4hr S&P500 Futures Trend Update
Crude oil recovers most its losses from Tuesday
Tuesday morning S&P500 look - 1 hour
Oil look for This delightful Tuesday morning
1 hour look at the Spooz - Air gaps under 1355
Post Apple Pseudo Flash Crash S&P Chart
30 min S&P500 Look for Monday March 5th
A Weekly Look at British Petroleum
30 minute look at Crude For Monday March 5th
39% and 49% - A Three Year RUT & SPX Look
S&P500 Futures Look for Friday March 2
The Infamous 'W' Pattern Formed in SPX
NYMEX oil futures Surge over 110 on Saudi Pipeline...
Early Look on Bond Weakness & Dollar Strength
►
February
(71)
Thursday Evening Crude Chart update
Bonds down Dollar down Equities Clown Down - SPX
30 year bonds Show volatility & TBT rallies
Pre Market Look at the S&P Futures -
Copper Acting Out This Tuesday Morning
Quick look at YM (Mini Dow Futures)
Post Cash Close S&P500 Futures Chart
Mid morning S&P 500 Futures Look. Post noise of CC...
Post Feburary Consumer Confidence S&P Futures Look...
10 year look at the QQQ's
Gasoline Futures doubled since Bush Left Office
Post 15 min Trend Break CL update
stockmonster trade thoughts from this morning -
Monday Crude Oil Futures Update
Nasdaq initial weakness bought - Similar to Thursd...
The Q's
1's and 2's - A 20 year look at the SPY
Nasdaq Composite Trades into 11 year highs
Post breach of 107 CL 1hour Look -
▼
January
(74)
Crude Fails 98 only to regain. though down from 10...
Mid Day Light Sweet Crude Chart
10 year look at Radio Shack (RSH)
Monday Morning S&P500 note
Cash Closing print reaction in the S&P Futures
Weekly, Daily & 4hr S&P500 Chart -
1309.75 "pinch" - Afternoon S&P Note
Last hour S&P500 Future Update
Interesting Bullish VIX activity under 18..
Quick S&P500 Chart update
Thusday Morning S&P Futures Note
Wednesday Evening S&P500 Note - Chart
Post FOMC S&P500 Note -
10 year Nasdaq highs on 5 year volume lows (AAPL)
Post Close S&P's Chart -
The Auto Pilot Market - Afternoon S&P Futures Note...
Chesapeake Cuts Production. Will other producers f...
Light Sweet Nearing Pinch Point @ 99.95 (USO)
Monday Morning S&P500 note
January OPEX S&P500 Futures Note
GOOGLE misses EPS - pulls NDX down
Sonar Report: VIX Vega Trade (VXX)
Crude Trend Compared to Yesterday Very similar
Morning S&P500 Futures Chart
New Year Highs in the S&P500 reached 1307.5 (SPX)
Crude Oil Futures open HIgher this evening USO
Deal or no Deal - Euro Continues the march towards...
Guess this Chart - (XHB)
Needle Spikes of Buying within Broadening pattern ...
Germany Downgraded S&P500 Soars!!!!
Wednesday Morning S&P500 Look
A Monthly Look at Cree inc. (CREE)
Oil Wants 101.01. officially 45 hours of buying. 2...
Post Head & Shoulders Breakdown S&P500 update
Watson Pharmasutical Chart UPdate
Rough Head & Shoulders in the S&P500 (SPX)
Crude Oil Chart for Tuesday Morning (USO)
1300 Reached in the S&P Futures - now what?
Market Holiday crude; broadening/consolidation Pat...
Crude vs. S&P500 chart For this evening
Friday SPOOZ update 1285 mounted
Down @ the CME in the CMZ for Friday the 13th talk...
Mid Friday S&P500 Futures Look
Crude Oil Futures Chart For Today
Crude update Post 98.50 trade.
Daily Gold Chart Update
Crude oil UPdate post embargo headline -
Quick look at VIX action past 7 days (VXX)
Mid Day S&P500 futures Chart
Quick Look At Research in Motion Price Action (RIM...
This Morning's S&P500 Futures Chart (emini)
15 min West Texas Intermediate Chart
Transocean Finding a bottom of the RIG?
A Look At the materials (XLB)
Mid Day S&P500 futures Chart - Jump Ball
A monthly look at the Nat Gas ETF (UNG)
A Monthly & Daily Look at Bank of America (BAC)
Trading Places Orange Juice Scene -
Pre cash close s&p500 Futures Chart
15min post cash open S&P500 futures chart
S&P500 Futures Morning LOOK
S&P500 Futures Look For Monday
WTI Crude Futures Look For this evening (USO)
S&P500 Futures Morning Chart Look
Mid session Crude WTI chart
Euro VS dollar
Quick Netflix Chart -
Chart of the DAY
Alligator Pattern in the S&P's
The Perma-Bid
Slight Euro / Equities Contraction
Euro and S&P 500 divergence perhaps nearing Snappi...
Crude Closed over the PhsychoTechnical Level of 10...
Crude Trades over 102
►
2011
(746)
►
December
(62)
►
November
(85)
►
October
(82)
►
September
(81)
►
August
(77)
►
July
(41)
►
June
(27)
►
May
(13)
►
April
(17)
►
March
(90)
►
February
(76)
►
January
(95)
►
2010
(477)
►
December
(102)
►
November
(75)
►
October
(89)
►
September
(102)
►
August
(36)
►
July
(5)
►
June
(5)
►
May
(4)
►
April
(12)
►
March
(24)
►
February
(15)
►
January
(8)
►
2009
(140)
►
December
(9)
►
November
(17)
►
October
(11)
►
September
(5)
►
August
(14)
►
July
(15)
►
June
(25)
►
May
(20)
►
April
(23)
►
March
(1)
►
2008
(50)
►
February
(9)
►
January
(41)
radar url - website widget