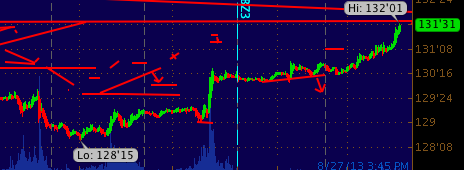
Sellputs also contributes @ Clusterstock --------------- StockTwits --------------- Boston WM ---------------

Monday, February 8, 2010

How many times have we seen this chart? Hasbro

VIEW COMMENTS
The open today was quiet with only a few names standing out. After the moves in the market late last week i am fully expecting a boring flat day today. As you can see we are literally flat on the day as of 1:35. The market needs time to digest, i still think we move lower over time. Notice how down candles are quicker and more violent then the steady slow up candles.

One in name in particular which IS active HAS (Hasbro) she was up about 9% premarket. Of course this told me she was going to gap up, only a matter of if she would hold the gap and continue higher or collapse. I waited for the trade to play out before i did anything, she opened traded higher initially but came back putting in a base at 34, a nice round number. From that point i put in an alert which would trigger if HAS traded below 34, the alert did not go off. HAS traded up 80 cents, came back down and caught a bid at 34.20, which was higher than its previous support. This point combined with the opening prices created 3 points for an uptrend line. This is where to buy, because the price action has confirmed this is indeed one of those trades which is a slow burner but will eventually break higher later in the day, patience is the key.

My previous post on AUXL a similar chart for comparison:

Scenario recognition or (Edge as i like to say) makes this trade work, if you have not seen this type of chart prior to today you would have overlooked it and moved on. To me this is a very low risk high reward trade because of the clear support (buyer) and positive news. The buyer is just a slow patient turtle looking to gobble up shares at a steady pace. If there was not a clear buyer the PPS would have collapsed given the market weakness.

Those of you who would like more information about last Thursdays price action, here is a great Barron's article highlighting the day.

Sunday, February 7, 2010

For all you football fans... Go Colts.

VIEW COMMENTS
I hope they do not manage their own money..

Friday, February 5, 2010

What happend at 3.05pm? SPY ghost rally

VIEW COMMENTS
Your guess is a good as mine, I do not believe it was simply "Friday short covering" something else was going on. The school of fish did not just decide to cover their shorts at exactly the same time within 3 minutes of each other. Like everyone else, this move caught me off guard as well, fortunately i was flat going into this move. I had been taking off shorts lightening up on all my puts spreads just before this happened. The VIX collapsed in seconds causing the price of options to collapse, if you were short VOL great, but many people were long vol not expecting the PPT to come in and run us up into positive territory with ZERO catalyst.

Per my research into the trades, you can see in the chart above there were around 8 million shares traded in the SPY within 3 minutes (liftoff) which equates to roughly 850,000,000$ where did this money come from? What account executed this trade? The answers to these questions will probably never be known though what is obvious and disgusting is clearly the PPT wanted DOW to close above 10,000 for psychological reasons. Give it up, let this market trade this cannot go on forever, people are starting to catch on. With threats of regulatory reform within the year coupled with the recent dollars strength, the market has clear headwinds. Blatant market manipulation has to stop, until it stops the street will not have full confidence in our capital markets.

UPDATE: ZeroHedge posted a great article highlighting the JPM desk gunning the SPY... 

Go Colts.

Thursday, February 4, 2010

S&P500 trend clearly broken.... now what?

VIEW COMMENTS
I bet you thought i had the answer for ya.. I do not. Though i can say the general thesis over on my side of the table, "all the king's men cannot put humpty dumpty back together again", IS bearish. The magic hand cannot keep this market from falling, think "House of Morgan", eventually the market will overtake the PPT (plunge protection team) no matter what the circumstances.


The price action we saw today (Thursday February 4, 2010) confirmed the street is indeed selling, which is NOT the standard tip toeing around whacking a few bids then reverse/retrace. Commodities, energy, tech and financials all fell today with vigor! Days like today give me chills, the feeling is so familiar. Accelerated selling out of nowhere is a product of retail, mutual funds and hedgies exiting the casino. The roulette ball has spun, settled and the inside numbers are about to be cleared. You lose. The only player who won sold 100 S&P handles ago, the rest of the players are left watching their chips swept into the black hole next to the dealer. Folks, this market will steal your money, if you are wise you will not be robbed.
Pay attention to the signals the market is giving us, the single biggest signal i received was the market's reaction to our President's recent ideas of "regulation and reform". DAMN YOU FAT CATS!! pshh ... The fat cats put you in office, you think middle class money really put you and your pals into office? Hell no, wealth ORIGINALLY generated via Wall street did.

The history of our markets show us politics trump hard economic numbers and fundamentals... if economic numbers and fundamentals are horrible, threats of capital market regulation and reform are only going to constrict a already gasping market. Who wants to be long when you have no idea what our federal government has up its sleeve (or even knows what the hell is going on), and is itching to F$% everything up just to say they did "something"?

What i want you to take away from this post is, take a look at the charts, listen to the signals, interpret the signals correctly, manage risk. Flatten out, remove risk, take profits before the PPT is overpowered and the bottom falls out overnight. I am not saying get short by any means, i believe the safest strategy for people who have recouped much of their losses the last year is preserve, hibernate until the turbulence passes. Hedge Accordingly

Wednesday, February 3, 2010

How many times have you seen this chart?

VIEW COMMENTS
Everyday this market gives us the same cards over an over, the best way to benefit from this is pattern recognition because a lot of the time these patterns are not just random and are not coincidence. The pattern i think is the most prevalent and most interesting is the gap up, consolidate sideways most of the mid day then break higher on a slightly upward sloping trend. Patience, patience and more patience is the key to these trades.

The chart on the left is of
AUXL, she had FDA approval this morning sending here to gap territory. You can see how it opened at 30 traded to a round number 32, then sold back down to a round number 31. The average joe trader would have puked and moved on. If you had pattern recognition of this scenario you would have had more confidence to hold trade. The level II almost gives you no information, the information you need to focus on is technical levels, support/resistance. You can see if you were patient and held the PPS slowly moved back up to 32, eventually pushing through traded all the way to 33. You will begin to notice many charts like this, gap up/sell/trade up/ break highs/ sideways/ break high. AONE yesterday is an example of this also.