Friday, July 29, 2011

A Refresher Course On How A Bill Becomes A Law


Different Day Same Prices. What A Difference Two Days Makes.. (VXX)

ES 5 min
Good afternoon ladies, one this different about today.. The babe is different.. anyway you can see from the headline there is not any new prices to talk abou today besides the very short lived low in the ES of 1278.5 this past evening as word got out the debt vote was delayed. 1290 being support intra day a level which was sticky in the overnight session as well. you can bet stops reside below with level and any trades over 1300 will surely trigger a buy program....

Today the Boehner debt for is scheduled for 6pm eastern, perfect timing for the last trading day of the month? Yeah you got me there.. Clearly traders are still very cautiously optimistic about the outcome of the debt situation,

Thursday, July 28, 2011

Post Close Nasdaq and S&P500 charts (QQQ)

NDX 15 min
Today's index price action was nothing more than the classic 'line em' up to knock em' down' trade. I did get a little wild on twitter this morning as i expressed my views about the ridiculous zero positive news 1.9% NDX race higher off 2358.

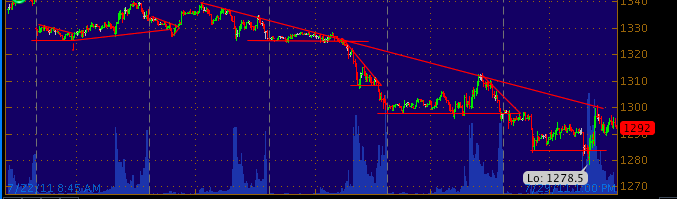
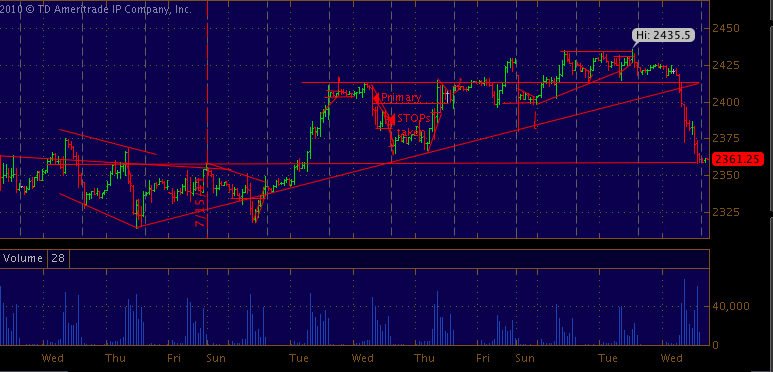
Technicals are still in play as you can see from the chart to the left with the 2360 level being the algo launching pad. For all you 'minimalist' traders how is the above chart Pretty minimal... volume and price action combined with a bit of lines highlighting trends which my mind draws for me. yours should to. in time. An no these lines were not 'form fit' check my pervious posts. Clearly 2360 is a line in the sand, with 2355.75 being the low. The SPOOS (s&p futures) pushed through yesterdays lows of 1295.75 into the close of cash.... Tonight the political theatre continues..

rant begins.....................after the jump

Wednesday, July 27, 2011

A 1hour Look At The Nasdaq (QQQ)

1 hour time frame
The NDX 100 made 10 year highs yesterday of 2435.5, today the NDX made lows not seen since July 17. On this same day the market lurched higher on some bullshit news which is not even worth mentioning because the volume that day was NOTHING compared to today.

 The reason i think technical analysis on this index is so important is because tech has led our market ever since 1998 up and down. Embrace and adapt.

Today The Market Became Lucid As Reality Set In (SPY)

5 min S&P futures
Well well well what do we have here? A trending down day without taking the escalator up post 'profit taking', hmm this is something worth noting.

In all seriousness we have not had a sustained down day (specifically in the NDX) of -2.5% or more in quite sometime. And no i do not think this is simply profit taking, this is the positioning of funds and banks ahead of the debt ceiling deadline. Delta hedging and or puking,

Monday, July 25, 2011

Tonight's Correlations, Euro Focus (EUR)

1 min frame
Interesting price action this evening, the party began with euro spikage about an hour ago. Zerohedge is reporting there has been a blast in Macau, though i have not seen a source as of yet.

What is clear is the Euro trading in a very bullish stair step pattern at a seemingly random time with 1.4465 being the high print.

Equity index's were delayed in their reaction to the

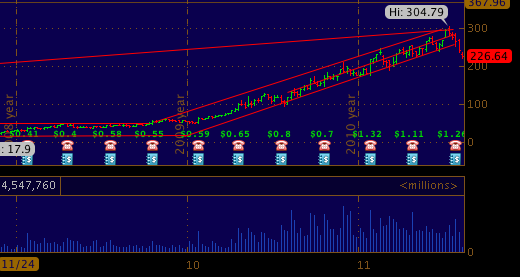
Netflix From 3 to 300, What Is Next ? (NFLX)

UPDATED 8/8/2011
NFLX
Monthly NFLX
Netflix reported their Q2 numbers after the bell today, they beat on EPS but missed on revenue. The subscriber base once again grew, but still no real color on retention of legacy accounts vs. new customers.
 2Q EPS $1.26, EST. $1.12,
 SEES 3Q EPS 72C-$1.07
2Q REV. $789M, EST. $790.5M.

My feeling is the die hard NFLX fans are getting a bit tired of same old content & waiting for new streaming additions.. Not to mention the increase in subscription prices.. The increased subscription revenue will more likely be seen in full affect by the end of Q3, as they surely did nothing to help Q2.

Tonights Commodity & Equity Index Futures Correlations QQQ

Hello my fearless volatility riders as you can see the old ramp and crap trade is still going strong. I think this is the 4th Sunday night in a row the futures have traded considerably below where they settled on Friday afternoon.

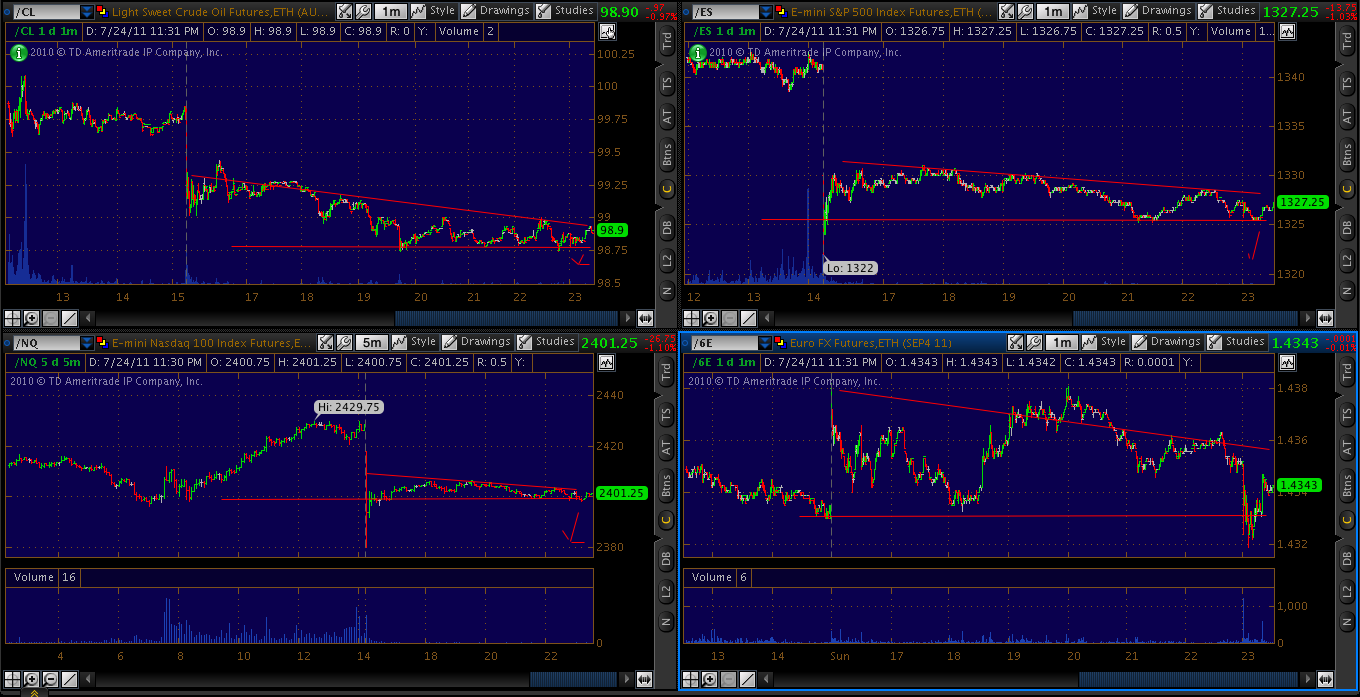
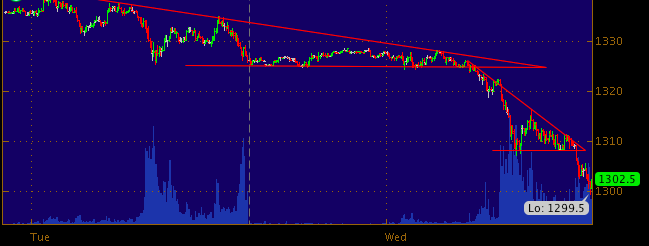
The level in play in the NQ_F is 2400 which correlates to 1325 ES_F. If 2400 does not hold 1320 will be in play in the ES with 1322 being the low print of the session. When headlines rule a market momentum picks up as key levels break on the downside and or upside, in this case downside.

Friday, July 22, 2011

My Friday Evening Starbucks Experience (SBUX)

You know the economy is off kilter when you encounter a seemingly normal looking person pulling hot dogs and corn on the cobs, clearly fresh and prepared in his kitchen to starbucks.
video

Thursday, July 21, 2011

A 15 Minuted Look At The Nasdaq 100 (NDX)

As the Euro debt crises honeymoon rally rolls on, so do the charts. Now that the 2400 level has been recaptured we must focus on the level the bots are focused on. This level is the upside resistance that is 2415, over this we within 11 year NDX highs of 2428....

15 min NQ
Draw your conclusions, if we let the past dictate the future the NDX could fail up here. Headlines rule this market.

This Afternoons NDX 5min Chart (QQQ)

My tweets last evening around 5pm were spot on in regards to euro & crude strength. Euro has continued higher pushing crude over the 100 level for the first time in weeks. The NDX has been testing the 2340 level this afternoon as volumes declined. 2415.5 is resistance in the NQ_F, though one can argue the current formation is a bull wedge or descending triangle....

S&P thoughts:
1345 in the ES has been the upper line in the sane, if we penetrate this level to the upside we could see 1355 easily. This entire market is driven by headlines which dictate the future, we need to live in the present because the present is what we are living.

Wednesday, July 20, 2011

McDonalds Customer Throws Ice Cream, Slaps Employee (MCD)

wow.
911 operator: "are you hurt?

Shift manager "no just sticky"


Nasdaq 100 Chart For This Evening (QQQ)

1 min frame
Today after Tuesday's largest single day rally % wise so far this year, the index's ran out of steam. Volume picked up this morning as the night rider robots lost control of the daisy chain......This makes perfect sense because the notional value of market depth reaches a 'less easily manipulated threshold' when the cash market is fully open.

Anyway, INTC reported after the bell with tepid results, stock is down AH. Same goes for QCOM.. You got yahoo finance putting up headlines which to the casual investor look great, though the real story is the #'s are a mirage and the stocks are down. Apple BLEW OUT yesterday.. though the stock faded like a crackhead without a fix once the algo's lost control of the after hour party time 405pps 'kiss'.

As for the NDX 1 min chart above you can see around 8:30 EST the NDX fell off the 2410 level like Humpty Dumpty and proceeded to trade in a consolidation pattern under the hypotenuse of a descending triangle which you can see highlighted. I mentioned on twitter a break of the 2380 level in the NQ would trigger some sell stops, sure enough it did. Patience. 2370 traded 15 min later.

Tuesday, July 19, 2011

Tonight's Crude 5 Min Chart (USO)

Looks like 99 is in the cards as the global equity edge and hedge trade plays on like the guitar of jimmy buffet.

When The Robots Are Driving You Gotta Ride The Train (SPY)

1 min NQ
A quick look at tonights 1 min NQ_F chart, or nasdaq 100 futures if you are not familiar with the symbol.

Anyway it looks like it is a sure thing we are going over 2411 before we see the sun in Chicago tomorrow. Because i know you love these videos so much i provided train riding music for you......


Apple Pre Earnings Charts - (AAPL)

POST AAPL  EPS 1 min
PRE AAPL EPS 1 min

Apple reports Q3 EPS $7.79 vs. $5.80
Reports Q3 revenue $28.57B vs. $24.92B

com: Apple sold 20.34M iPhones in Q3, up 142% vs. last year


GUIDENCE down - 
. :thefl


Apple sees Q4 EPS about $5.50 vs. consensus $6.42
Sees Q4 revenue about $25B vs. consensus $27.7B


It looks like this will either break out to the upside right into the close then head to 390 or fail miserably..  its not gonna just sit here... Charts below.
15 min

Just Say The Words 'debt deal' & We Shall Be Healed (USO)

15 min crude futures
As our president began speaking at around 1:30 eastern time crude oil began levitating off the 98 level on considerable volume. Crude went on to move 50c in 5 minutes, then moved another 50c in another 5 minutes.. you can see this in the chart above.

Moves like this are not common place nor  particularly normal for this product without some concrete news. Well the catalyst for this move was Obama muttering about a 'debt deal', this sent the algos and global edge and hedge cross asset arb computers into a tizzy. The dollar futures were slammed and index futures bought simultaneously. It is just that easy folks.

Bank of America Trade Set Up (BAC)

Scenario recognition and pairing trade pattern identification with their most probable outcomes is a skill day traders develop over time. This skill you really cannot obtain by reading books you must sit in front of the screen and watch them play out. over and over...

The setup i would like you to focus on is a bearish pattern in BAC, many identify the formation below as a descending triangle.

Triangles show a big move into the formation of the triangle followed by consolidation within the triangle as the price gets closer to the apex where a break out usually occurs. A descending triangle can fail to the upside violently as well as continue the prior trend a bit more orderly to the downside. The break down continuation level in the chart above is 9.40 as you can see is the low, upside fail is about 9.46. 

With continued pressure on the banks post Goldman EPS this morning it is anybody's guess where BAC will end up, my guess is below 9. 

Mid Day Charting of the S&P500 (SPX)

After the jubilant housing starts number and the blowout quarter for GS, #sarcasm the index have jumped over a percent to test 1315 in spoos and 2388 ndx... Once the robots stopped their at usual time around 10 am the market has gone into VWAP drift battle bot mode.. Take a look at the rough H&S we have on the 1 min S&P futures chart.
1 min SPOO

Monday, July 18, 2011

Cisco to layoff 6,500 employees & take $1.3B charge (CSCO)

It is never good to hear this ahead of APPLE eps tomorrow after the close as after IBM's tepid results.

Anyway the blogging community was ahead of the ball on this CSCO story as it has been rumored 10k were going to be laid off months ago. The robots pushed the pedal to the metal jerking the NDX nice and high so the landing will be softer tomorrow. CSCO also sold a mexico plant of theirs to Foxxconn......

Goldman reports before the open tomorrow as well as Coca Cola (KO)


IBM reported Q2 EPS $3.09 vs. $3.03
Reported Q2 revenue $26.67B vs. $25.35B

Take a look at the 1 min NQ_F chart showing POST evening session open pop of 10 handles .

One Hour Time Frame Descending Triangle in Spoos (SPY)

1hr Spoos
As you may or may not have realized we did not break the 7/12 low in the ES_F of 1295.25, not to say this is not impossible today by any means. What told me the spoos would remain weak was crude oils weakness despite the nasdaq strength, sure enough this proved correct as the correlations snapped back to congruence.

 The HF crowd sucked in the buyers the last hour Friday once again only to slam down their throats after tickling their hope the first 25 minutes of regular session. The chart to the right is a 1 hour of the S&P futures contract, 1300 was and is the lower line in the sand.

With the debt ceiling issues still swirling and a global economy still unsure if it is in a recovery or a depression its is no surprise equity index's are having upside momentum troubles.

Sunday, July 17, 2011

Crude Oil & Equity Index Futures 1 hour Charts (SPY)

As you can see from below the 1hr charts for crude/ S&P/ NDX are still in a downtrend with the overnight action and the KISS of 1301.5 in ES. Crude is in a pennant with 96 being lower support. ES in descending triangle.


All charts are 1h, notice the 1300 level as well as the 96.80-97 level... The global edge and hedge trade is pulling on sentiment once again this late summer Sunday evening.
1hr

Billy Walters 60 Minutes - One Long Hustle

Worth noting is near the end of the video when Billy goes on to talk about how the stock market is the only market that hustled him.. 'the hustler from vegas got hustled by wall street'


Friday, July 15, 2011

VIX Volatility Report For Friday (VXX)

Interesting action on this OPEX summer Friday.


Thursday, July 14, 2011

This Mornings Correlations and QE3 Chatter (SPY)

Once again the manic market shows the momentum players who is boss this morning. We had rampage all morning from the wee hours till about 45 min after the open when Bernanke uttered the phrase

"Bernanke Says No Current Plans For More Stimulus"  This sent the market index's and commodities into a free fall as the dollar perked up off lows. 


Crude specifically hit the hardest down over 1.7% from highs of 98.90ish, gold and silver took it on the chin as well. Remember playing with momentum is like playing with gasoline in a super soaker, it is fun and enchanting while the fire is hot but when the pressure gets lower and the flame reaches the tank she blows up in your face. 


The low in the ES_F so far this regular session is 1311.25 overnight low was 1305.75 . The NQ_F is leading the index's again which saw negative territory for a brief minute under 2340. Looks for a choppy ride up until August 2nd because these markets havent a clue what to do. When you couple summer trading doldrums, sovereign debt risk and domestic debt issues you get some interesting price action not for the faint at heart. 

Wednesday, July 13, 2011

My Man Mitch... McConnell That Is (UUP)

Now that McConnell has thrown his arms up in desperation, who do you think will be next... ? This whole situation is a big game, with real consequences. The stakes are high, even though most uninformed Americans think our country runs on funny money. There will come a point were we cannot go back to the dealer and ask to play again.

With even the scent of a US debt downgrade/default in the air our markets shutter in fear.  The scent of QE sends the index's rising like the smoke from our ashes.

 What scent will our elected officials smell in about two weeks, i think we all better hope it is neither. As for tonight's threat by Moody's on the rating of the US debt, bring it on. The system we created has now become self aware.

Tuesday, July 12, 2011

S&P500 5 min Chart Update Post EURO collapse (SPY)

Heck of a morning to be doing what comes natural, sleep eh? A 25 handle retrace in the SPZ and nearly 40 handles from low in the NQ all before 5 am makes for an interesting morning to say the least.. Heck at least 50% of market participants have no idea what happened in the early hours of Euro session, success says some.

With rumors of a France debt situation it is clear Europe is in a huge mess and not confined. The dollar really rocketed on the Euro weakness as 1.40 broke with conviction, the dollar does not look so bad when everyone realizes how bad the sovereign debt crisis really is. Though unfortunately the dollar has given up all gains to trade back to the 75 level POST FOMC.
5 min ES

Monday, July 11, 2011

Chasing The Unknown Is a Low Probability Trade (QQQ)

Below friday's NFP low of 2376ish.
5 min NQ_F

Sunday, July 10, 2011

Tonights 1 Min Crude & Equity Index Charts

Friday's hour long orgasm of buying a Bull trap? or a pile of bear crap?

1 min 

Saturday, July 9, 2011

A Quick Look A Friday's NDX Price Action (QQQ)

Friday morning presented a hell of a shorting opportunity, for press release/economic # print reading algorithms that is. The NDX fell 25 handles in one fell swoop as NFP printed a gain of roughly 19k which is absolutely pathetic. On the bright side at least the index traded in a pattern when we have seen before 'elevator own, escalator up', unlike last week.
5 min

The chart below is a 5 min, i posted a chart Friday morning highlighting the H&S pattern you see which did marginally play out as the textbooks convey though this is where is the only 'normalcy' of the day. 


The last 1.5 hours of the day the NDX traded nearly at a 90 degree angle off lows below 2280 as if some wonderful news hit the tape which created a buy panic. To bad this was not the case. Monday should be interesting. 

Friday, July 8, 2011

Rough H&S in the NASDAQ on the 1 min frame (QQQ)

H&S terminated and broke a low out of the right shoulder.
updated 1 min

The Lower & The Volume Goes Stronger Bids Become? (QQQ)

Well NFP really shellacked the markets after a parabolic move the last 9 sessions, question is can we take out the NFP print low in the futures? This a question for the PPT and bob pisani for sure. The chart below shows the nearly daily normal trend of declining volume as time progressing post open. What is not normal is the fact bids becoming stronger and stronger as volume becomes lower and lower.
1 min NDX

You Want Dow 13k Plus You get Crude 100+ (USO)

Crude tonight is acting independently of other assets which are playing nice against their risk baskets. Below is a 15 min crude.
15 min CL

Wednesday, July 6, 2011

Tonights Correlations (SPX)

The Spoos has met 1340, the euro is being pushed up into buy stops... the market is primed. 1 min chart below of NQ CL 6E and ES. Enjoy and god speed.

Hydraulic Fracturing Process via Exxon Mobil (XOM)

Now you know....


Nothing Worse Than A Sinking Transocean (RIG)

According to buds offshore energy, there are reports a Transocean rig is in danger of sinking, 68 evacuated. Watch the 61.25 support level for a breach... and quick sell off.
RIG 1 min

Tuesday, July 5, 2011

Today's Tunes by Hybrid

Keep it in the family


No Mans Land Below Is Below 1330 (SPY)

After last weeks epic examination of shorts bears like myself are now scratching our asses, though i am not dead. Yet. Anyway today we are seeing some lackadaisical price action which is expected after a 7% straight up move in about 5.5 days. The chart below is of the S&P500 futures contract which the area of focus is the white box. If the price moves into this area, it is anybody's guess where the index will go but it is a good bet you can expect wide price swings as this area is digested. 
5 min SPOOS

2011 Milken Global Conference

I had the pleasure of speaking at the 2011 Milken Global conference in Beverly Hill this past March. The panel was made up of individuals who use the social media space in conjunction with investing.

Panelists:

Chris Albinson, Managing Director, Panorama Capital

Scott Burns, Director of ETF, Closed-End Fund and Alternatives Research, Morningstar

Tom Lydon, Publisher, ETF Trends

Evan McDaniel, Chief Information Officer, MerlinOne Trading Partners

Jon Najarian, Co-Founder, optionMonster.com

Moderator:

Dennis Kneale, Senior Correspondent, Fox Business Network


 For more information on the panel and bio's of the panelists as well as a 80 minute video of the discussion follow this link.

Saturday, July 2, 2011

Peter Gabriel - Big Time

Some theme music for this Saturday's Babe of The Day 

Friday, July 1, 2011

Volatility Sonar Report (VIX)

via @optionmonster