
|
| 1 min RIMM showing the ascending triangle break out over 14.50 |

|
|
| 1 min RIMM showing the ascending triangle break out over 14.50 |
|
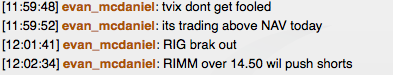
| 15 min AAPL - gap is the grey rectangle |

|
| aapl 1 min |

|
| Reverse ant eater formation (Bullish) |
|
| ant eater - blown out pivot formation. (bearish) |

|
| daily GC |

|
| 15 min AAPL |

|
| 15 min AAPL |

|
| 5 min CL |

|
| 1 hour CL |
|
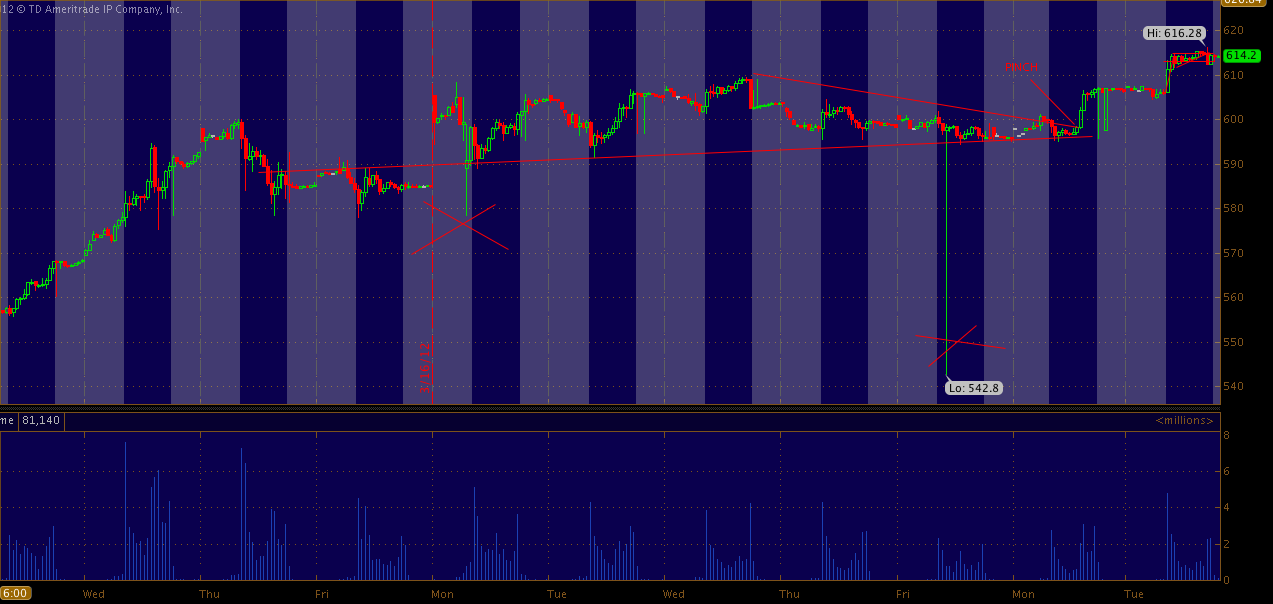
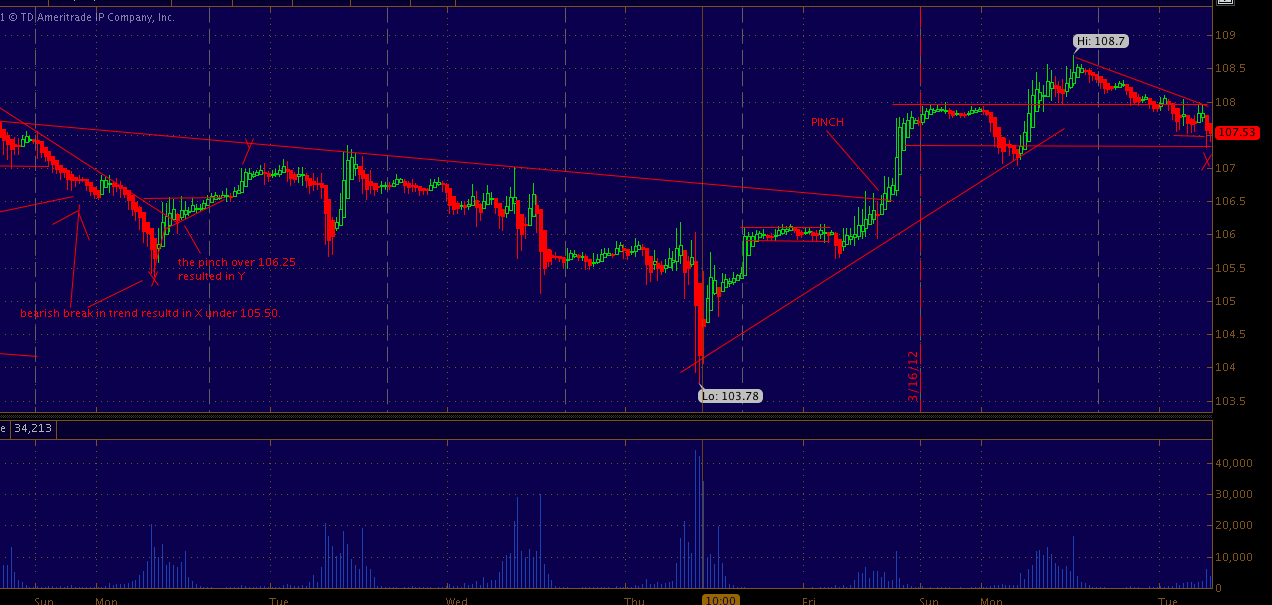
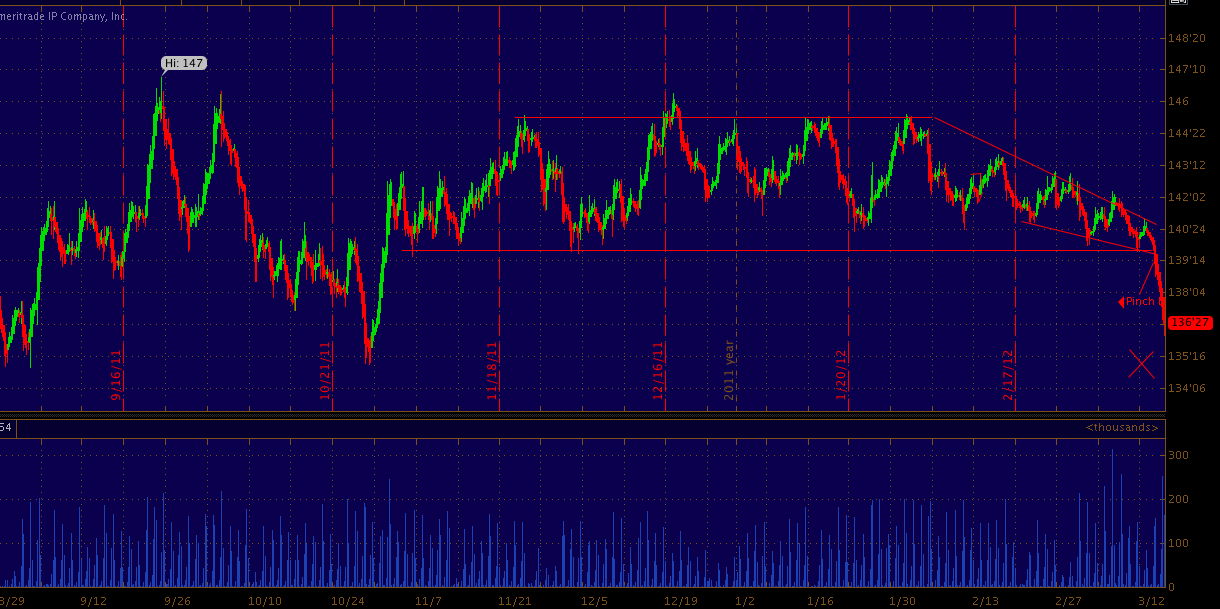
| 30 min AAPL. notice the RED x's where the tails first manifested... then the the FRIDAY tail.. preceded the PINCH into 616 |

|
| aapl 1 min |
|
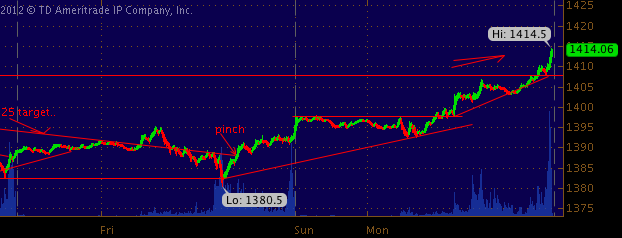
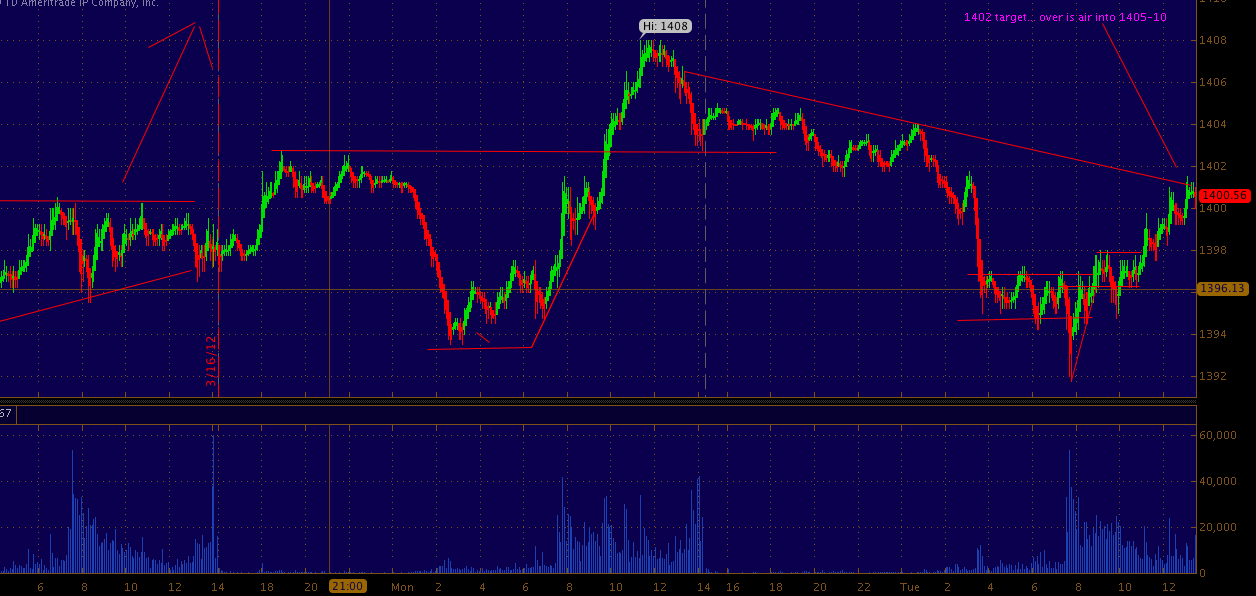
| 5 min ES |
|
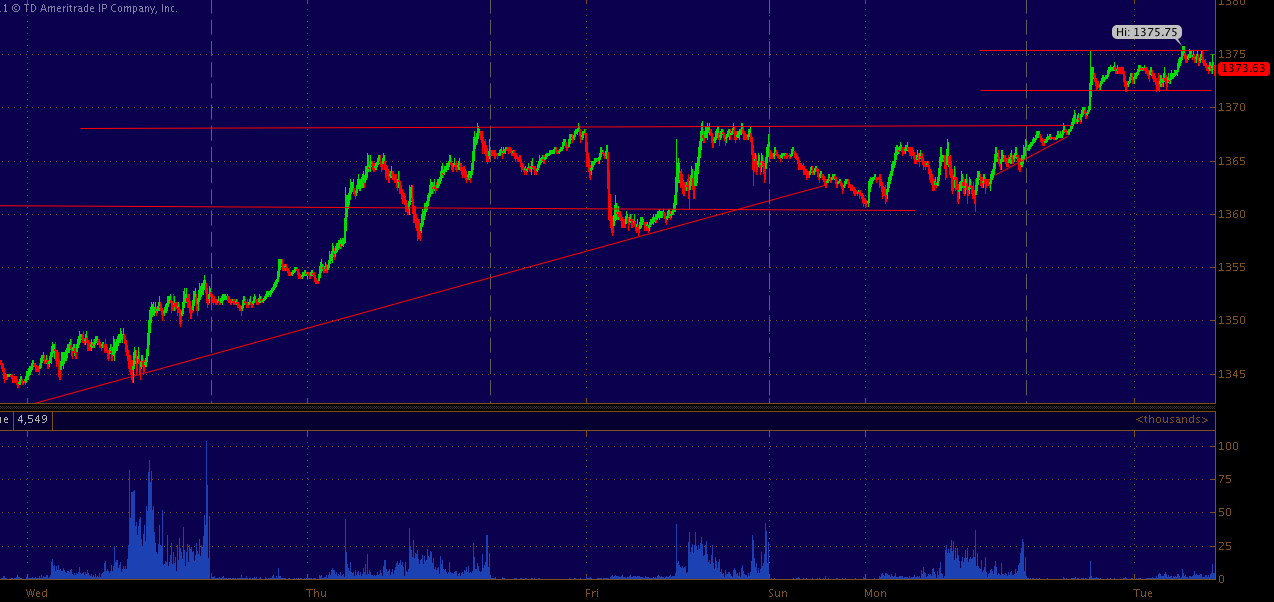
| 30 min ES_F |
Refer to below for my thoughts on Oil (played out 100%) and ES pinch, which did indeed play out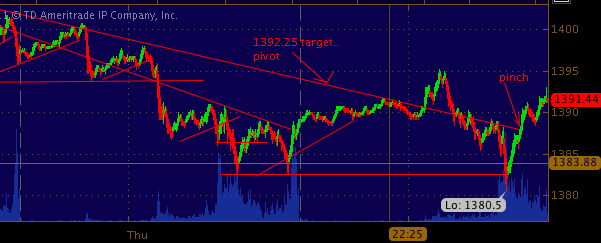

|
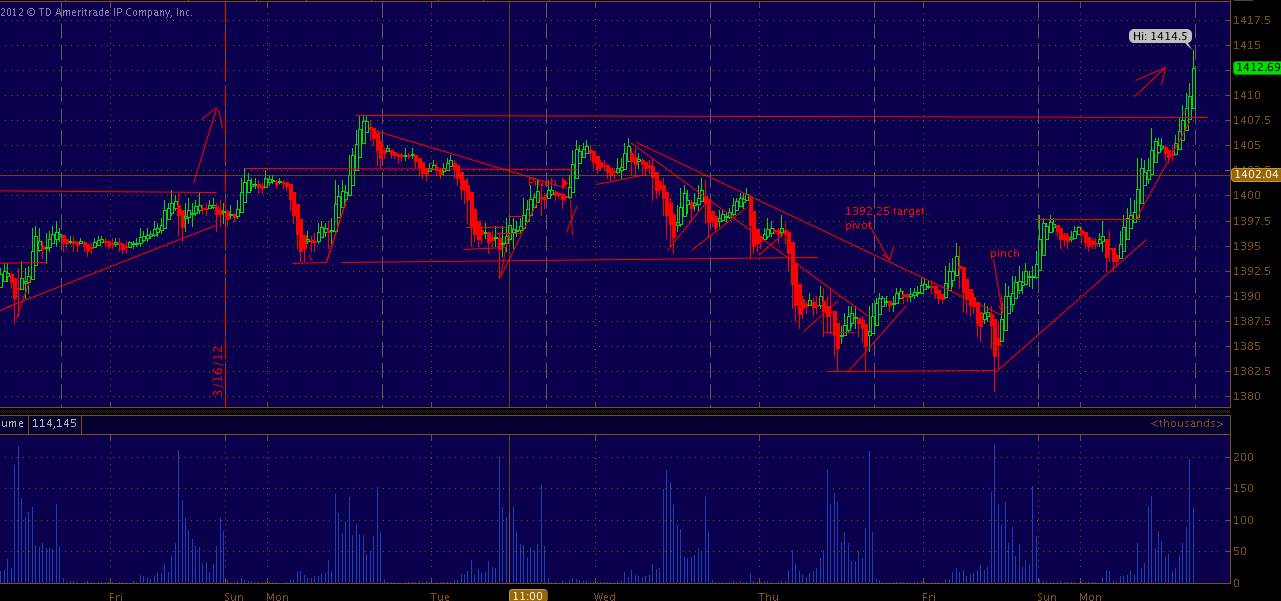
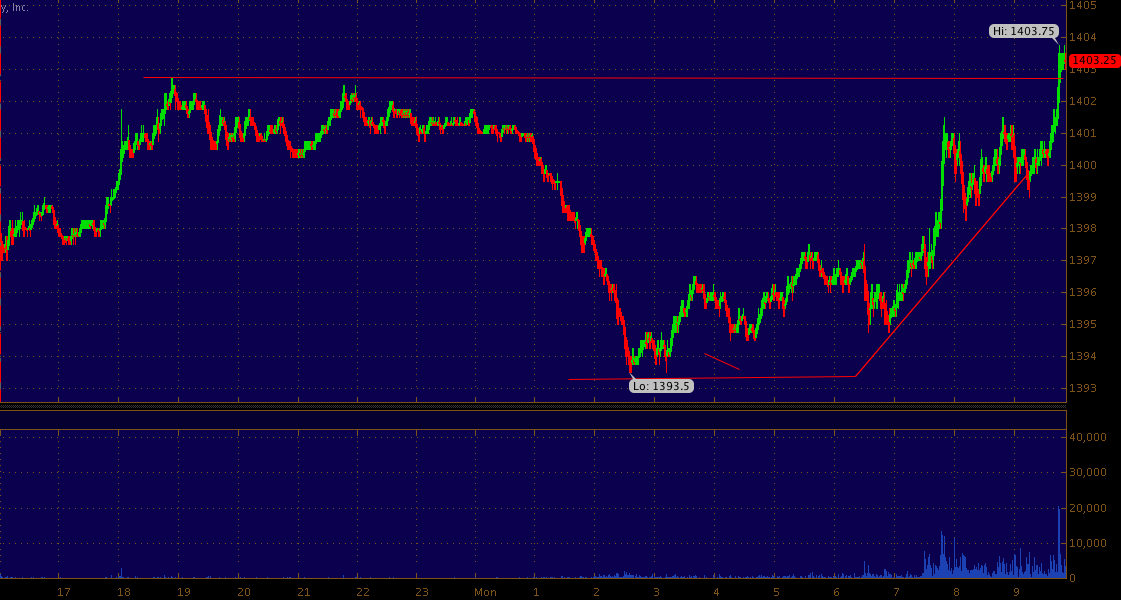
| 5 min zoom ES march 22 |

|
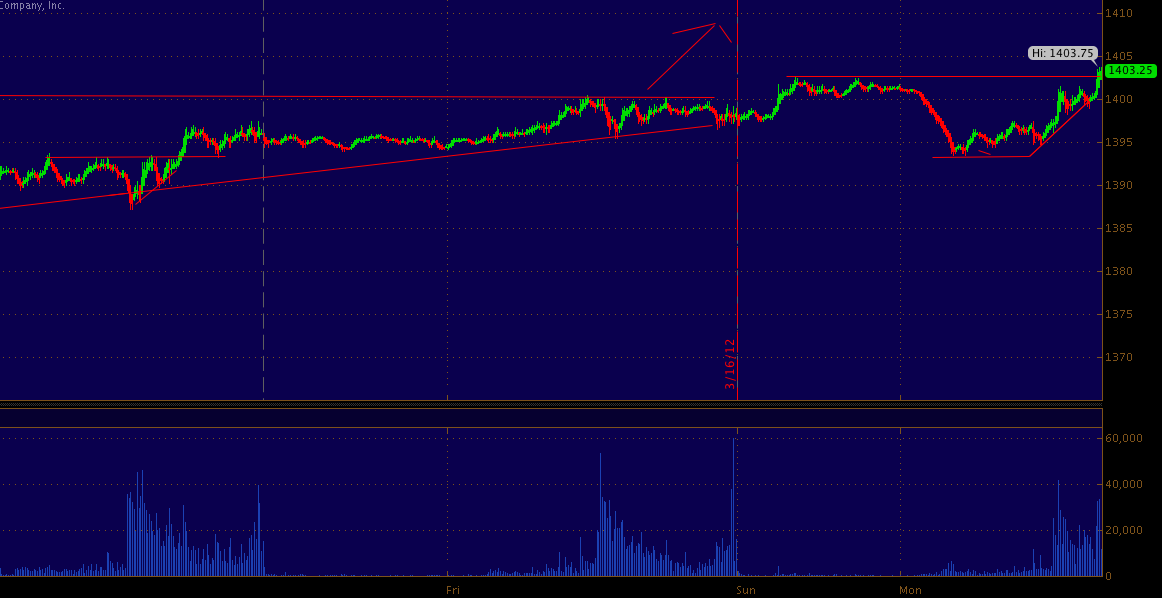
| 5 min zoomed out ES |

|
| 15 min ES |
|
| 5 min ES |
|
| 1 min AAPL |

|
| 1 min zoom |

|
| 1 min ES |
|
| CL / AAPL 1 min charts |
|
| 30 min CL |
|
| 5 min CL |
|
| 5 min ES |
|
| 1min ES |

|
| 5 min CL |

|
| 5 min CL |

|
| 5 min CL |

|
| 4 hour zoom CL - note the channel breach to upside. |

|
| 1 hour ES |

|
| 1 min AAPL - NOTE the large AH print of 700K+ shares bought |

|
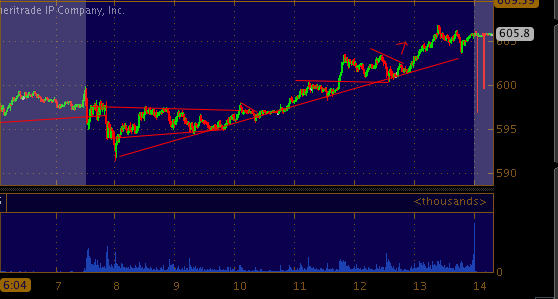
| 5 min AAPL |

|
| 1 hour ZB |
|
| Daily ZB |

|
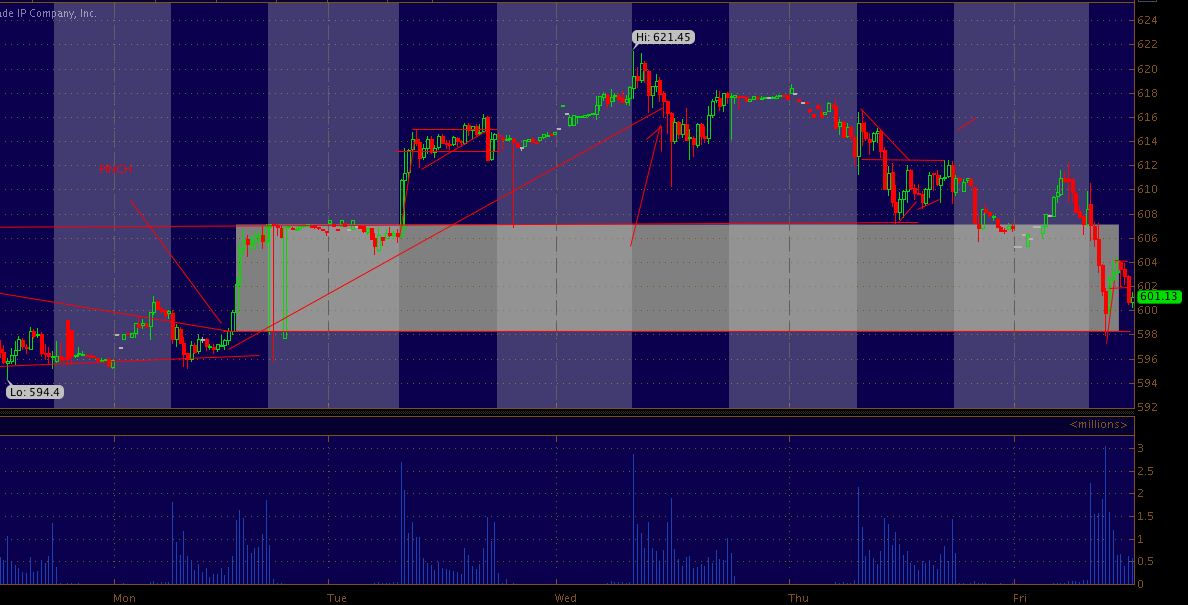
| 15 min VIX. post spike |

|
| 15 min VIX |

|
| DailyVIX |

|
| 5 min ES |
|
| 5 min ES |
|
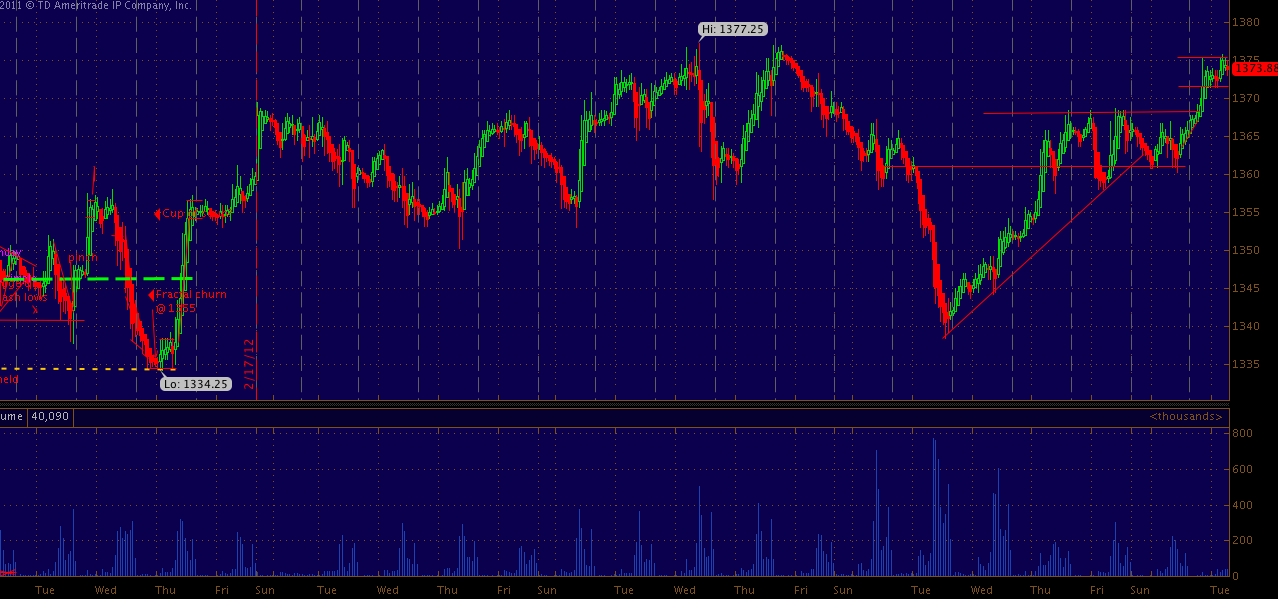
| 1 hour ES |

|
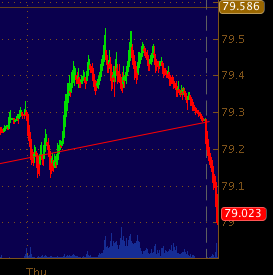
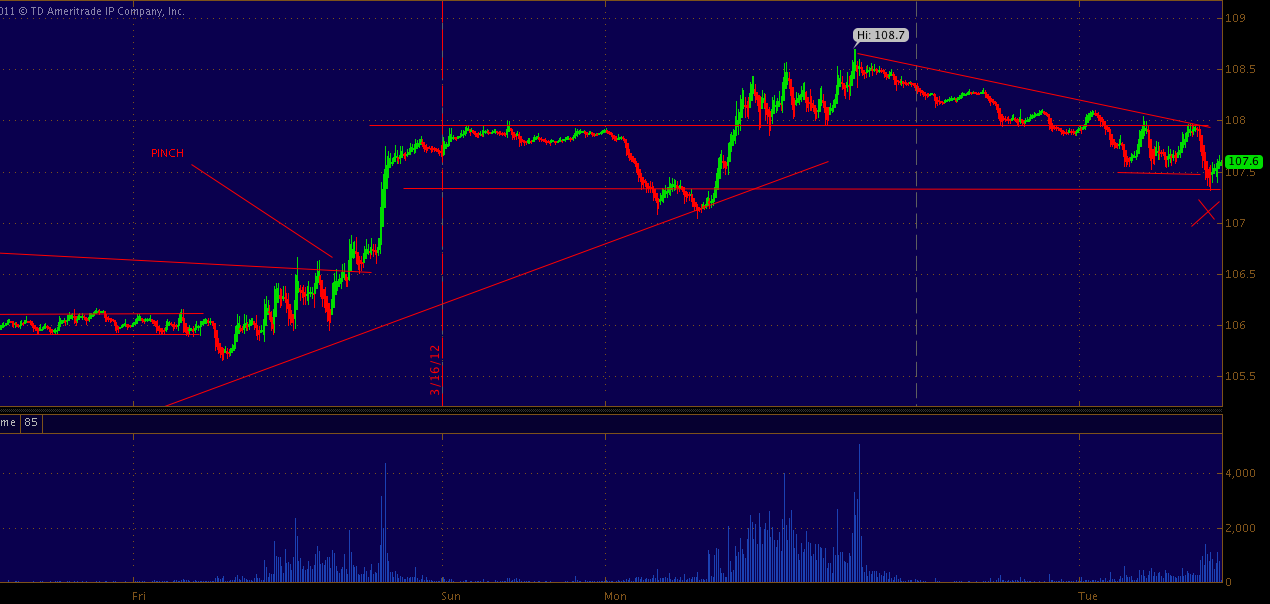
| CL 15 min - 107 was the ledge from sunday evening. regaining this ledge presents a more bullish picture for Tuesday. |

|
| 15 min ES |
|
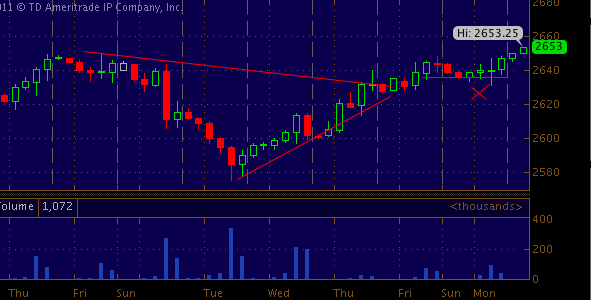
| 4 hour NQ futures. |