Monday, December 31, 2012

S&P 500 futures trade 1425 after talks progress - Happy New Year

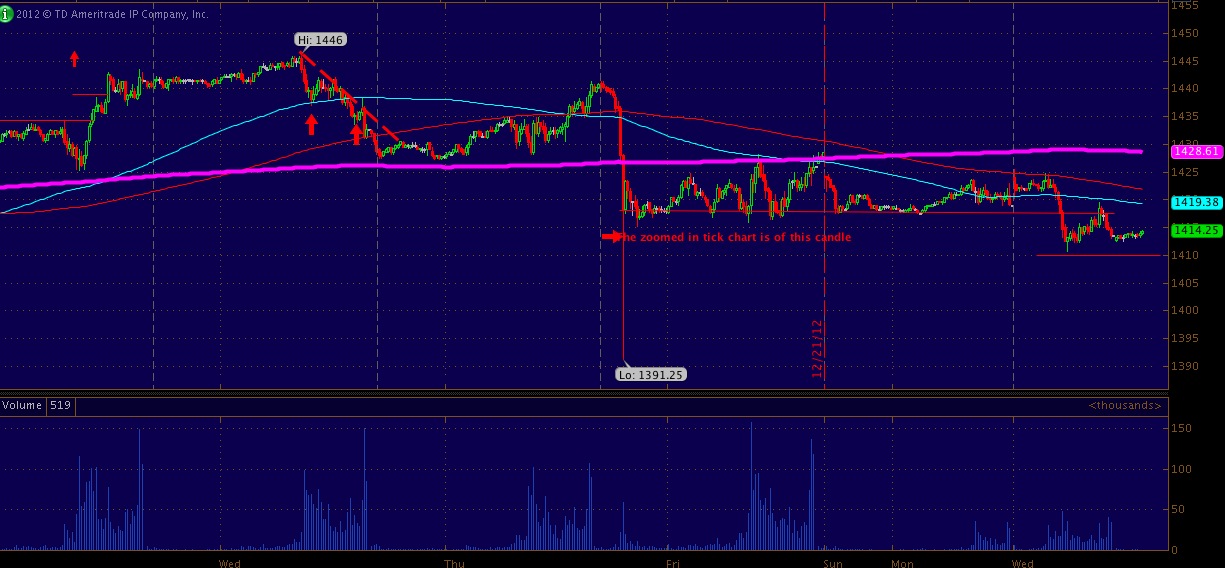
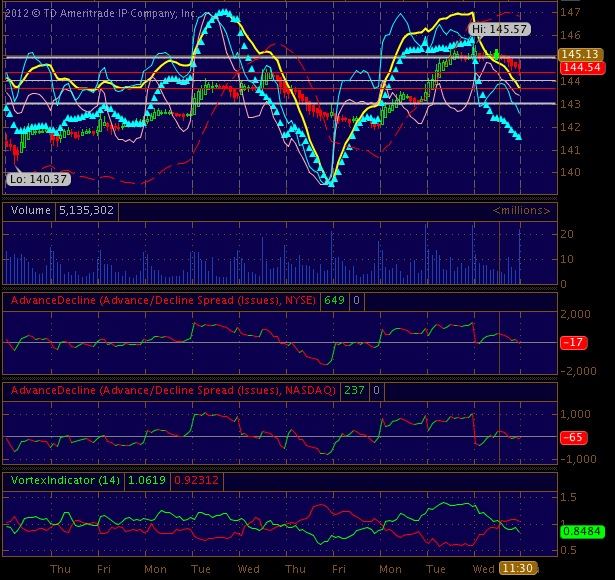
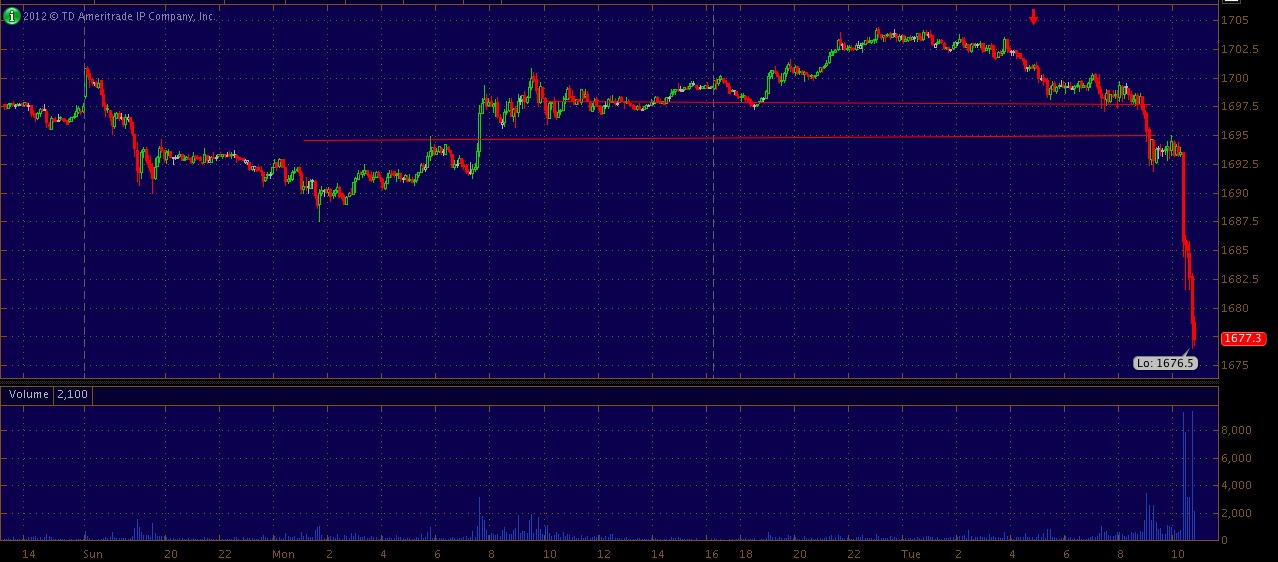
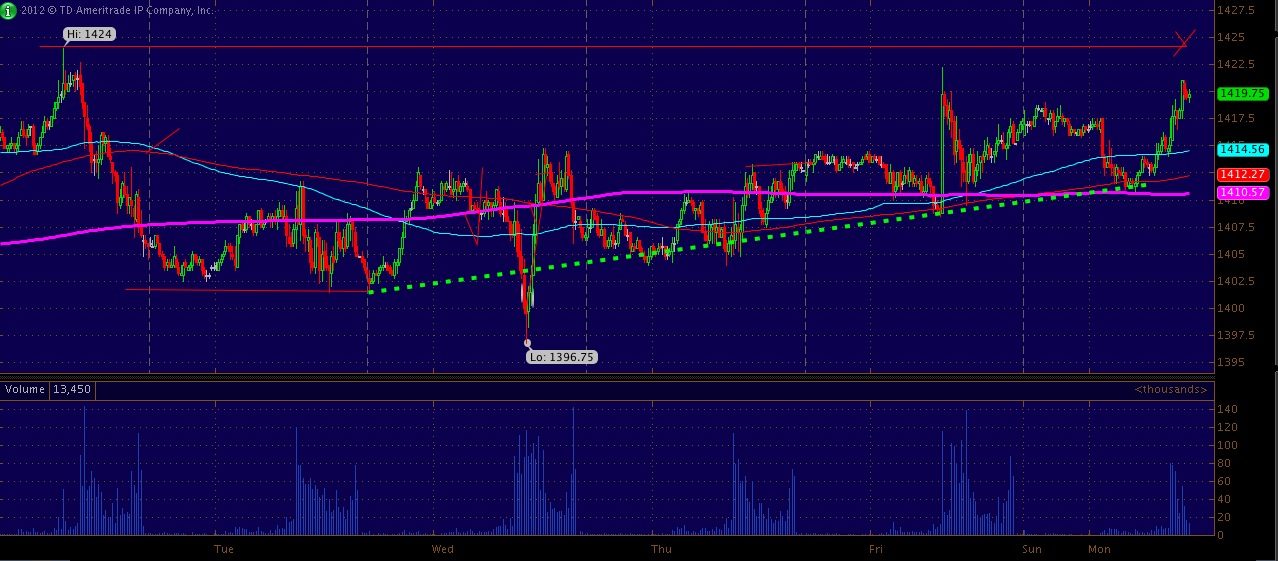
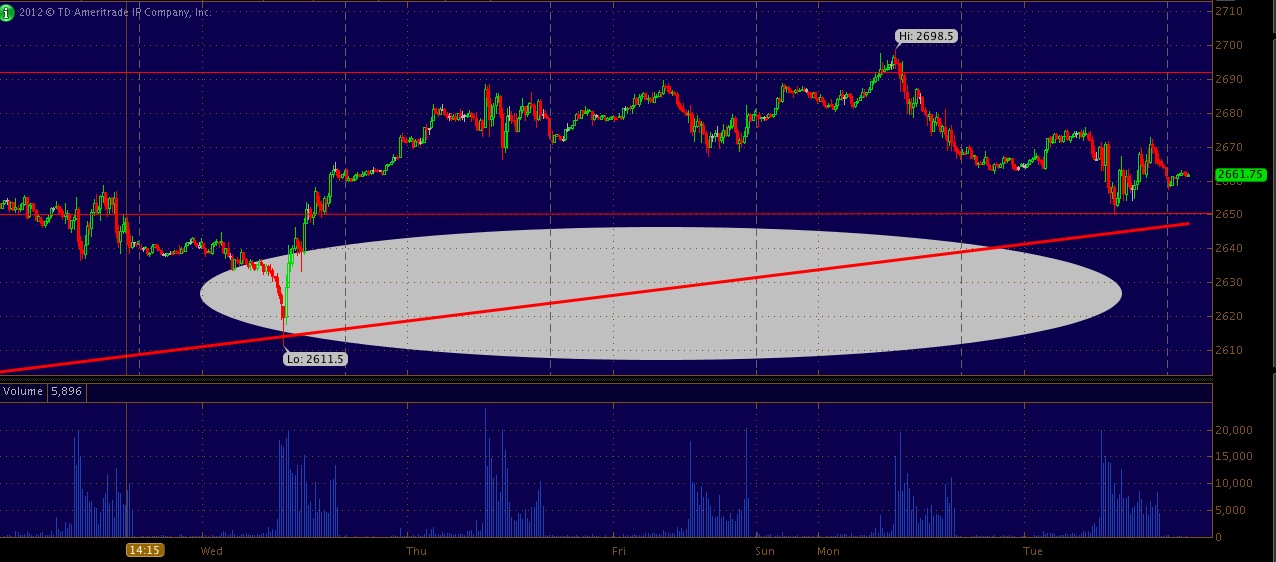
1 min ES_F showing highs 1425.75
Happy new year from Hedge.Ly. We would like to thank you for your continued perusal of our articles.

We hope you learn something but most of all remember you must craft your own plan before you can succeed in your own trading.

Do not let today's bullishness catch you with your pants down as deal or no deal is still being played on capital hill. It looks as if a deal is priced in and we will continue on a path higher if a deal is reached.

Friday, December 28, 2012

S&P Futures Tear through Mini-flash Lows of 1391.25 after White House debt talks fail

1 hour
This post builds upon our post from December 26th. 
The chart on the left is solely mean't to show how much significance the 1410 level has gathered since the market recovered following last Thursday night's drop.  
Under this level means we move into gap territory down into 1391.25 as the lower tail of thursday nights 1 min candle is essentially a air gap.

Wednesday, December 26, 2012

A look at the $ES_F as 1410 gathers weight

15 min ES
The chart on the left is solely mean't to show how much significance the 1410 level has gathered since the market recovered following last Thursday night's drop.

Under this level means we move into gap territory down into 1391.25 as the lower tail of thursday nights 1 min candle is essentially a air gap.

A look at Marvell Shares Following Today's Drop | $MRVL

1 min MRVL 
Following the late day ruling against Marvell to the tune of $1.7Bil for infringing on Carnegie Mellon University patents shares of MRVL became cannon fodder for the bored day trader.

The result is depicted on the left.
(Bloomberg) A U.S. jury ordered Marvell Technology Group Ltd. (MRVL) to pay $1.17 billion in damages that may be tripled for infringing patents on integrated-circuit technology held by Carnegie MellonUniversity.
A 5 minute view is below.  Also do you think perhaps someone got wind Friday of this ruling?

A look at the $CL_F chart post break of 4 hour resistance

4 hour CL (notice break of green dashed) 
Well well well.. SOMETHING had to act out today might as well be crude.

War games in the Straight of Hormuz could be to blame for this break over the 90.14 four hour resistance level.

BUT my guess the move was catalyzed by the mid east news coupled and  natural price action pushed the price over resistance during today's thin trade.

Monday, December 24, 2012

Merry Christmas | Market Vectors Oil Services ETF Ex-Div

5 min OIH
Merry Christmas from Hedge.Ly


Market Vectors Oil Services ETF traded Ex-Div today.

Dividend pay schedule below the fold. 

Friday, December 21, 2012

The Fiscal Flash Crash Erased 32.5 S&P Points in 16 Seconds

32 handle 16 second (click for larger)
We all know what happened last night and probably have realized the world is still spinning and life will go on.

The question... "how can the market drop that far that fast?" Is easier to answer with the chart on the left. 

Thursday, December 20, 2012

Merry Cliffmass: The S&P 500 futures fall off a cliff... the fiscal cliff

5 min ES_F 
 Our elected morons in Washington have failed to come to a resolve on the debt issue. Because of this the S&P futures fell nearly 3 percent into 1391 from 1430 or so.

Tomorrow as you know is the 'Supposed' end of the world so what is happening is pretty fitting. Not saying this is end of world but the COINCIDENCE is quite appalling.

Long night and morning ahead. stay tuned.

Ackman on Herbalife: we welcome them suing us $HLF |

Bill Ackman, CEO of Pershing Square Capital Management, spoke with Bloomberg Television's Erik Schatzker and Stephanie Ruhle about Herbalife and said that
 "this is the highest conviction I have ever had about any investment I have ever made, full stop."

Crude acting out in a sluggish tape | $CL_F

5 min 
1 min 


Backlight - Money and Speed: Inside The Black Box | flash crash |

'Backlight - Money and Speed' is a great 50 minute film about the 'flash crash' and the proliferation electronic trading and the tribulations which has come with this proliferation.

The image to the left is that of the Nasdaq data center with a investment bank a few hundred feet away with their data center. Movie below the fold....

Wednesday, December 19, 2012

CEO of Herbalife Reaction to Bill Ackman's accusations $HLF

As you know HLF stock was smashed this afternoon after Bill Ackman went on CNBC accusing the stock as a pyramid scheme.

Let the market decide i guess. But using the pulpet of national tv to talk your book of a prior established short is kinda cheap.. or genius. just depends how your brain is wired.

Video after the fold.....

A look at NYSE Euronext chart | $NYX

 A bit of news out of the WSJ hit late in the tape about ICE taking over the NYX. Shares popped. 31.25 is the 2012 high of NYX.

Below the fold you find the Daily NYX chart with the FEB high visible.. over 31.25 probably going to be some movement.

Sellers dominated the $SPX tape as $CL_F rallied |

After one of the ugliest final 15 minutes in quite sometime the SPX closed lower by10.98 points or 0.76 percent to close below the 1440 metric @ 1435.81.

If you look at the chart on the right (click to enlarge) you notice volume flipped from buyers in control (since Thursday mid day) to sellers in control @11:30 am today. This is noted by indicator at bottom of chart showing the converging green line with red.

Once this convergence occurred the indexes, specifically the spooz; sold clear down into Monday mid session territory 1431.25's.

$XHB homebuilders chart update |

Weekly XHB
 This post is a update-to-the-updated XHB | SPDR homebuilders ETF post(s).

The point of this post is to show how the street is usually wrong.. the XHB has been one of the best performing ETF's all year with a over 50% return in 2012 despite all the bashing, hatred and doom.

A look at February Crude now that 90 BBL traded |

30 min CL 
Our Crude post from yesterday is here. note the inverse H&S..

Inventories hit at 10:30 ET with little reaction from CL besides a pop up into 88.82's. 14 minutes passed then BOOM CL takes out highs and moves into 90.03 highs for the session.

What is funny is as this was happening CNBC was doing a hit on low fuel prices for holiday, specifically echoing the under 3$ a gallon in some areas.  Funny.

Tuesday, December 18, 2012

Update to the '5 min pattern to ponder' post from 12/11

30 min 
Previous post
Note the megaphone pattern denoted by the red dashed lines.

The Sharp V from Thursday weak close to Friday's strong open caused the 5 min pattern we highlighted last week to nearly come back to top of the bell/megaphone upper resistance.

666.79 - 1576.09 | $SPX 20 year look

20 year SPX
Monthly SPX 

Jeff Gundlach: investors should hold cash [video]

DoubleLine Capital CEO Jeff Gundlach told Bloomberg Television's Erik Schatzker and Stephanie Ruhle on "Market Makers" today that "investors should be holding cash" in this environment.
Gundlach said that
 risk assets have "diminishing returns"
on each round of QE and "it's almost like a half-life of a radioactive particle." video after the fold 

A look at the 30 year bond future & $TLT Charts

Daily TLT
With bonds falling into their lowest levels since late October 2012 you must take a look at what resides below the 120 level TLT and the 143 level in the 30 year future.

Clearly the equity upside we have witnessed the past two sessions has been fueled by rotation out of safer assets such as gold/silver/bonds into risk assets.

Amazon Approaching all time highs once again

Daily AMZN
Quick thought here on AMZN....  Now that u see the SPX and NDX carving out the right shoulder of a inverse H&S AMZN is also on the right shoulder. 260.73 is the high today so far with 264.11 being the all time high for the shares back on 9/14/2012.

Gold Futures break 1695 falling to 1678

5 min GC 
Not sure what the catalyst is here for the sharp move lower but me thinks it has to do with some not so happy participants regarding the upside move in equities the last two days.

The break of 1700 pre-cash session was telling but the break down below last week lows of 1696 was the catalyst for the move into a 1676.50 day low as stops were crushed under 1690 and 1680.

A Daily & 4 hour look at the $SPX

4 hour SPX
The 1440 SPX level coincides with 1435 in the S&P futures which happens to be right at the neckline of a inverse H&S with 1440 being the break out level in SPX.  click on the chart to the left for a larger version.

The head of the inverse H&S is down @ 1343 or so.  Over 1441 will surely piss off sellers and cause chasers to chase.

A 5min & 30 min look at the Crude oil chart | $CL_F |

 5 min
 Crude failed the 88.04 metric about 15 minutes into the cash session after melting higher most of the overnight session.

This pattern of melt-up then sharp sell off as cash session gets going is one that manifests itself more often than not.

Monday, December 17, 2012

A look at the 4 hour $ES_F chart |


 This post is simply a update to a previous post from December 7, 2012. 
Just a quick thought this Friday night..... When looking at the 4 hour ES_F you can see a rough inverse H&S with the head d0own under 1340 with the right shoulder currently being carved out..

A look @ Bank of America post 11 break out | $BAC |

Monthly BAC
We have not spoke about Bank of America since January 10, 2012 when we highlighted shares a nearing pinch point which would cause a upside deviation of the downtrend in place from the pre subprime crisis high of 55.08 in late 2006.

Since that post the stock's price has remained over the 6.90 pinch level.

A look at Crude oil futures post February Roll

4 hour Feb crude
 87 proved as support this morning as buyers defended the post roll territory pushing the price up into 88 briefly.

The inverses H&S on the December contract looks a bit more clear today. Over 88 means we test 88.26, the previous high for the February contract.  88.78 remains max resistance for today.

Sunday, December 16, 2012

A look at the $ES_F ahead of Monday's Open

5 min
So far risk has been the theme this Sunday evening with the mini's trading as high as 1417.25 before fading to 1414 support where the mini's have gravitated the past few weeks.

 On the the low end we have 1412.50 as support under 1414 on the march contract.

Friday, December 14, 2012

One cannot argue how close $AAPL is to the edge

daily aapl 

505 in 3.2.1........


Roubini: US will go over cliff; markets to force agreement

Nouriel Roubini appeared on "Bloomberg Surveillance" with Tom Keene today and said that U.S. growth will be "barely 1.7%" in 2013.   Roubini also said....
"there's a highly likely chance we're going to go over the cliff. If we do so, the market reaction is going to force the two sides to reach an agreement." 

Wednesday, December 12, 2012

Live Stream of the 12/12/12 Sandy Relief Concert @ MSG

A look at the $ES_F post gap up then fade (SPY)

5 min SPY
As predicted yesterday evening.
 "SPY specially.. this amplifying pattern.. focus on the cyan line.. the squares are prediction .. triangles past data.  This could indicate another positive open with sellers quick defend."
SPY gapped into 144.02 and ran into a high of 144.55

Tuesday, December 11, 2012

A 5 minute pattern to ponder (SPY)

5 min SPY 
SPY specially.. this amplifying pattern.. focus on the cyan line.. the squares are prediction .. triangles past data.

This could indicate another positive open with sellers quick defend.

BlackRock's Larry Fink: very bullish on US economy (SPX)

Larry Fink, CEO of BlackRock, guest hosted Bloomberg TV's "Market Makers" with Erik Schatzker and Stephanie Ruhle today.  Fink said that he's "very bullish" on the United States and "our corporations are in fabulous shape with $1.7 trillion in cash…I don't believe you're going to see that much default risk in the next few years." Video after the jump

Monday, December 10, 2012

Break out over 44 in shares of Sears Holdings (SHLD)

1 hour SHLD
Not seeing anything material.. but this chart makes sense after a epic slide from 63 two weeks ago...
.. inverse H&S with the neckline being 43.32...

As 1430 approaches we first must navigate 1424

15 in ES - 
This post dovetails off our from Friday (As the cliff approaches so does 1430)
With volumes in the mini's lowest in almost two weeks for a regular session we figured we would take the time to put up a few continuous ES charts showing pressure building under 1424 with the bead of the barrel affixed to 1430.

Daily and 4 hour look the Copper chart - $HG_F

The below HG pattern was first identified and shared with you on 11/12/2012

As you can see the repeating downtrending pattern found termination at 3.45 and since has moved back up to 3.7 with 3.80 a possible point of inflection as the new year approaches. Charts after the jump.

A hourly and 15 min look at Molycorp chart (MCP)

Moylcorp has taken out the 10 level on currently trading for 10.73 +19.50 percent.
1 hour MCP 
Took a while to break over resistance @ 9 but it did today with vigor. This is all i have. just pointing out a pattern if anyone has a interest.
1 hour MCP
15 min MCP

Friday, December 7, 2012

A 20 year look at the S&P 500 Chart - $ES_F

Kinda spooky.... will history repeat itself for a 3rd time with a failure of the 1550 area resulting in a crash below S&P 1000? or will we defy all the negativity and continue to meander towards 1550 without the "GIGANTIC H&S" completing itself as 2013 gets going.

If you look closely you will see during December of 1999 the ES traded between 1355 and 1489.
20 year ES

As the cliff approaches so does 1430 - $ES_F

Just a quick thought this Friday night..... When looking at the 4 hour ES_F you can see a rough inverse H&S with the head d0own under 1340 with the right shoulder currently being carved out..

A break over the 1420 level could trigger a move up into the 1433 (Green dot) support turned resistance area from the October 19, 2012 one year trend break from 1262 support.

Over the 1433 means the right shoulder breaks upward with a eventual conversion goal into 1468 with 1480 being a target.. this level coincides with the up-trendline (purple dotted) from 1262 extended upward into time. 

Of course the above scenario has positive thinking in mind when factoring in the *fiscal cliff outcome.
If we go diving... we could see the right should break clear into 1350 up-trending support (red line). 
4 hour ES
Daily ES

Wednesday, December 5, 2012

A 20 year look at the $AAPL Chart - Don't look

What is most startling beyond the obvious run up in price from $3.19 a share on July 7, 1997 to 705.07 on October 1, 2012. is the DRASTIC drop in volume since capitulation on 10/01/08 at 100 a share.

Something is going to cause this volume to pop back over the downtrending line almost four years in the making.... 535 is the line to watch going into tomorrow..... under we see a air gap into 505.

Below 500 could be the event horizon where gravity becomes so strong no matter can escape... or electrons for that matter. Until say  450?
20 year apple 
Monthly apple

Over the pink we are out of the stink in $ES_F ?

1 min ES - showing high..
1413.75 traded as the high so far...... 
we broke over the pink @ 1408.25 and raced straight into 1410.25 on highest 5 min volume of the day.
1 min ES_F
1408.25 could trigger a pinch back up into overnight highs 1412+ ...............kinda a interesting formation you can use in future... inverse H&S smiley
1 min ES_F

Tuesday, December 4, 2012

Following a piss poor start to December - a $NQ_F futures look

Update: Apple has ruined the party on the below chart...... down 22 points on the day.. low traded was 545.56 -5.13 percent.
AAPL 5 min 
Our Sunday evening post highlighting NQ pattern highlighted below..
SO far December has been a pile... nothing accomplished price wise beyond consolidation over 1400 following the standard holiday short squeeze end of November.. The level i am watching NQ is 2660 for support, the right shoulder.

2700 failed to trade this morning but we did get a pinch Monday, though the salmon could not swim against the fast current of the Capistrano streams.

4 hour NQ 4 hour
NQ right shoulder zoom on 15 min 

Newer Posts Older Posts Home